User Define View Geography/Maps
Geography shows the land and sea characteristics of the world. This is not an overlay that can be selected, but is set as part of the view.
To open Geography/Maps
- Click the View Settings button on the Main toolbar.
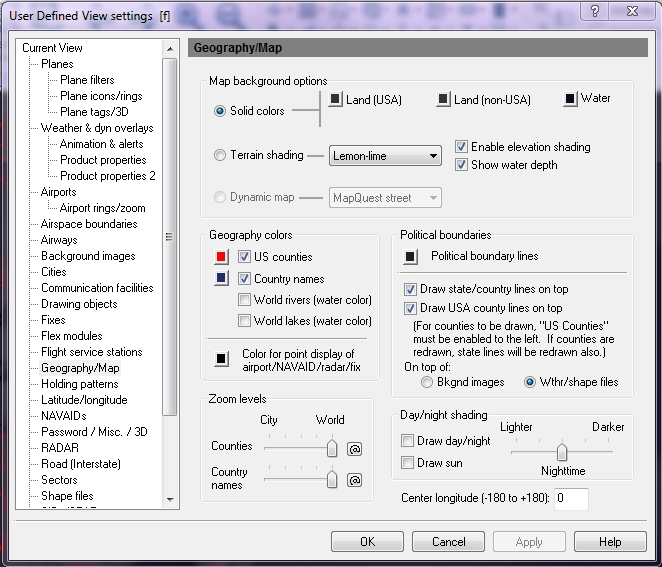
The User Defined View Settings window appears. - In the tree directory, click Geography/Map.
The Geography/Map tab appears.
|
Area |
Item |
Description |
|---|---|---|
|
Map options
|
Solid - indicates that you want to use a solid color on the map for the land and water. Click on the color box to change the color that appears on the map. |
|
|
Terrain shading - indicates that you want to use terrain shading on the map. |
Select from one of the following for terrain shading:
Enable elevation shading - check to indicate that you want to see mountain ranges on the map. Show water depth - check to indicate that you want to see different depths in the water. Different shades of blue indicate changes in depth of the water. |
|
|
Dynamic map |
Choose from:
|
|
|
Geography Colors |
US Counties |
Click to show all U.S. counties. Click the color box next to the check box if you want to change the color of the US Counties that appears on the map. |
|
Country Names |
Click to show all world country names. Click the color box next to the check box if you want to change the color of the country names that appears on the map. |
|
|
World Rivers |
Click to show all the rivers of the World (same color as water in the Geography Color section). |
|
|
World Lakes |
Click to show all the lakes of the World (same color as water in the Geography Color section). |
|
|
Color for Point Display of Airport / NAVAID / Radar / Fix |
When viewing a large geographical area, some overlays are displayed as colored single points (as opposed to their full symbol). Used to avoid screen clutter. Click the color box next to the check box if you want to change the color that appears on the map. |
|
|
Political Boundaries |
Political Boundary Lines |
The color of country and state lines. Click the color box next to the check box if you want to change the color of the political boundaries that appears on the map. |
|
Draw State / Country Lines on Top of Weather |
Click to show the U.S. state and country borders on top of any selected weather products, background images, and shape files. |
|
|
Draw USA County Lines on Top of Weather |
Click to show the USA county borders on top of any selected weather product. U.S. counties must be selected above to be drawn. When counties are redrawn, state lines are also redrawn. |
|
|
Bkgnd images |
Indicates that you want the boundaries to appear on top of the background images. With this selected, weather images cover up the boudaries. |
|
|
Wthr/shape files |
Indicates that you want the boundaries to appear on top of the weather images. |
|
|
Zoom Levels |
Use the slider to choose the level that counties are visible on-screen. Click the @ button to select the current zoom level. The corresponding item will be visible from the selected zoom level to the lowest zoom level (city).
|
|
|
Day / Night Shading |
Draw Day / Night |
Click to show day and night shading on top of background images. Use the slider to adjust the nighttime shading from lighter or darker. |
|
Draw Sun |
Click to show a graphical image of the Sun's position over the Earth. |
|
|
Center Longitude |
Use this option to always center your map on a specific longitudinal position upon starting the program or when using a non-projected view. This is useful when your work is focused on a particular part of a country or the globe. Enter a point from -180° to +180°.
|
|
|
Note Some computers may experience a performance penalty when using this feature due to lack of sufficient power or memory. |
||
