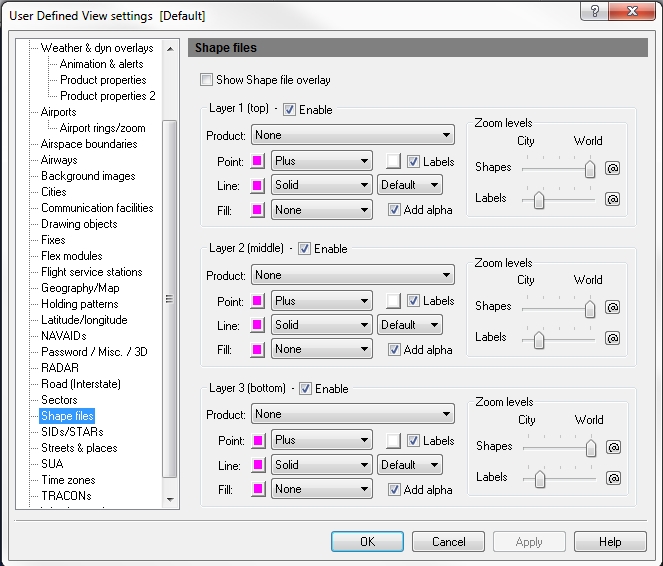
User Defined View Shape Files
You can use the Shapes window to manage how shapes appear on the map. To make landmarks and points of interest easier to find on the map, create custom shapes using Shape Files. Shapes are represented as points, lines, and polygons, which are geo-referenced features in a data set. They are used to indicate map references designated by the user.
![]() Opening the Shape Files window
Opening the Shape Files window
To Use a Shape File View:
Click the View Settings icon on the Main toolbar, User Defined View Settings (CTRL + V) on the View menu, and then click Shape Files, or the down arrow on the Shape Files Overlay icon on the Overlay toolbar, then Shape Files View Settings.
![]() Click to see the User Defined View Shape Files window
Click to see the User Defined View Shape Files window
A shape file stores geometric and attribute information as vector coordinates in a .dbf (dBASE) file, .shp (Main) file, and .shx (Index) file.
- .shp (Main) file - contains geometric attributes; shape type and vector coordinates.
- .shx (Index) file - contains offset and content length records that describe each item in the Main file.
- .dbf (dBASE) file - contains feature attributes for each item in the Main file.
Note Each file has the same name but unique extensions.
To Activate a Shape File View:
The overlay must be enabled first by clicking the Show Shape File Overlay check box in User Defined View Settings -> Shape Files or by clicking the down arrow on the Shape Files Overlay icon on the Overlay Toolbar, then selecting Shape Files View Settings.
To turn on the Shape Files overlay, click the Shape Files Overlay icon on the Overlay toolbar, or select Shape Files (ALT + Q) on the Overlays menu.
Shape File Properties
Styles and colors for each shape are selected in the Shape File window in User Defined Views. Each shape is applied to the screen as a separate layer with layer 1 over layer 2, and layer 2 over layer 3. The user decides what is in each layer.
|
Item |
Description |
|---|---|
|
Show Shape File overlay checkbox |
Click to show the Shape File overlay on the map. |
|
Layer Enable checkbox |
Check to show a layer as part of the Shape File overlay. One, two, or all layers can be active at any given time. |
|
Product box |
Click the arrow to select an object. |
|
Point Color button |
Click to open the color window and select a color. |
|
Point Style drop-down menu |
Click the arrow to select different point styles. |
|
Label Color button |
Click to open the color window and select a color (labels are names or titles). |
|
Labels checkbox |
Select to show labels on the map (labels are names or titles). |
|
Line Color button |
Click to open the color window and select a color. |
|
Line Style drop-down menu |
Click the arrow to select different line styles. |
|
Line Width drop-down menu |
Click the arrow to select line widths from default, 1(narrowest) through 5 (widest). |
|
Fill Color button |
Click to open the color window and select a color. |
|
Fill Style drop-down menu |
Click the arrow to select different fill styles. |
|
Add Alpha checkbox |
Select to allow for blending of overlapping shapes evenly. |
|
Zoom levels box |
Decide if shapes and labels should be visible on the map from the City (closest) level to the World (farthest) level.
|

