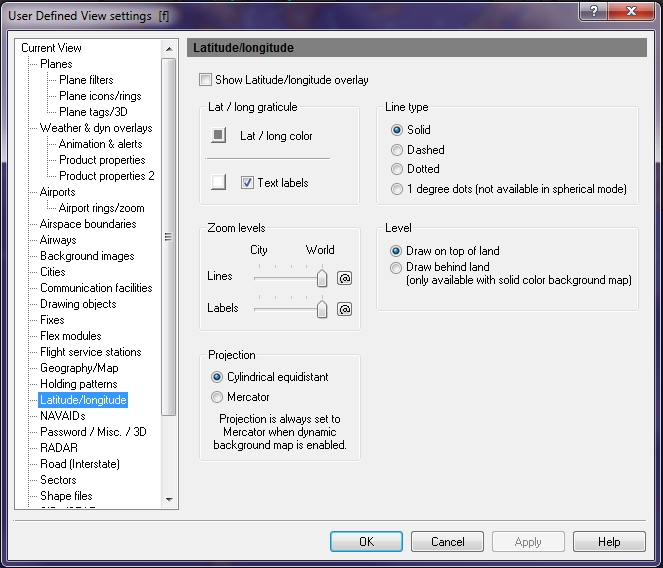
User Defined View Latitude / Longitude Window
You can use User Defined View Latitude / Longitude window to manage how the lines appear on the map.
To open the Latitude / Longitude window
- On the Main toolbar, click View Settings.
The User Defined View Settings window appears. - In the User Defined View Settings window, click Latitude/Longitude.
The Latitude/Longitude window appears.
|
Item |
Description |
|---|---|
|
Lat/Long Graticule |
Color can be selected for both latitude and longitude lines, as well as, for labels. Click the Text Label check box to turn on and off labels. |
| Lat / Long color - the color box indicates the color that the latitude and longitude lines will be when they appear on the map. You can click on the color box to select a color. | |
|
Line Type |
Specify the appearance of lines by selecting
|
|
Zoom Levels |
Choose at which level, lines and labels are visible on-screen. Click the @ button to select the current zoom level. The corresponding item will be visible from the selected zoom level to the lowest zoom level (city). |
|
Level |
Indicates how you want the lines to appear on the map.
|
|
Projection |
You can select how you want the Dynamic Maps to appear. By default, Dynamic Map uses Mercator.
|
Note To quickly enable text labels, click the arrow on the Lat / Lon Overlay icon on the Overlay toolbar and then select Show Text Labels. Labels are turned on and set to Full World zoom level by default.
|
Item |
Description |
|---|---|
|
Draw on Top of Land |
Shows lines as an overlay on top of the map. |
|
Draw behind Land |
Shows lines as an underlay behind the map. |
Note Changes made here will not be saved or take effect until Apply or OK is pressed.
