Surface Summary - METAR
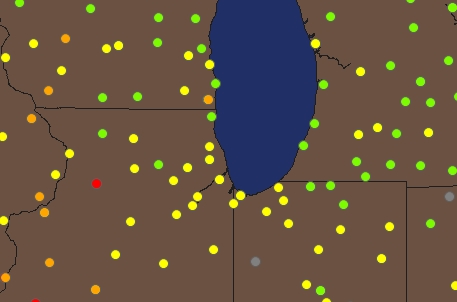
Surface Summary is a METAR (Meteorological Aviation Routine Weather Report) product that delivers hourly surface weather observations and reports. Considered a world-wide view of flight category conditions, updates are loaded every 5 minutes to have the most up-to-date weather data. Surface Summary can also be animated, see Weather & Dynamic Overlays.
When the mouse pointer hovers over a METAR area, a Hot Tip  or informational tag opens.
The weather product name is displayed along with details about each weather product such as, atmospheric levels) for Echo Tops (measured in thousands of feet or dBZ (decibels of reflectivity) for NEXRAD imagery. At this time, these tag lines cannot be customized.
![]() Click to see Surface Summary Weather
Click to see Surface Summary Weather
Airports are color coded to show ceiling / visibility range.
|
Color |
Description |
Ceiling |
Visibility |
|---|---|---|---|
|
Green |
VFR |
>3k ft |
> 5 mi. |
|
Yellow |
MVFR |
1k - 3k |
3 - 5 mi. |
|
Orange |
IFR |
500 - < 1k ft |
1 - < 3 mi. |
|
Red |
LIFR |
200 - < 500 ft |
1/2 to < 1 mi. |
|
Pink |
BCAT1 |
< 200 ft |
< 1/2 mi. |
|
Black |
|
Not Available |
|
To View Surface Summary Details
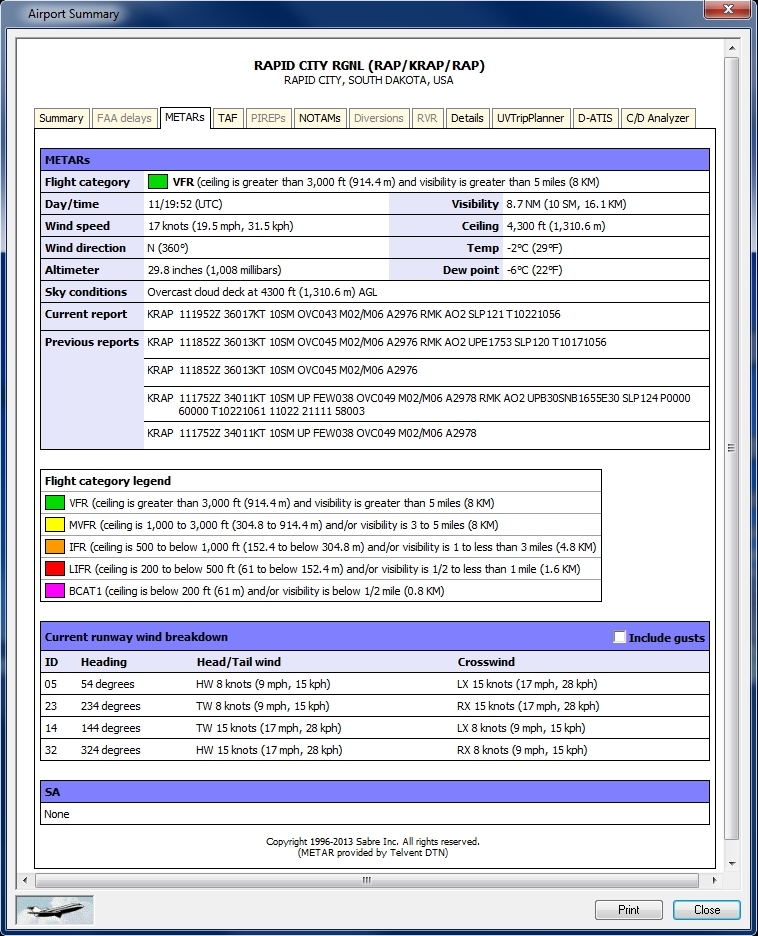
Position the mouse over an airport, right-click to display the shortcut menu and select Airport Summary.
![]() Click to see a Surface Summary Detail Sample
Click to see a Surface Summary Detail Sample
To Animate METAR
In the Ribbon Mode
- In the ribbon bar, click View Settings
 .
.
The User Defined View Settings window appears. - In the Weather & Dyn Overlays area, find the product layer where the Metar has already been selected.
- In the Animate column, click or ensure there is a check in the box.
- Click Apply.
The Metar will animate.
In the Toolbar Mode
- Select User Defined Views on the View menu.
- Click Weather & Dynamic Overlays and open the list.
- Click Surface Summary (METAR) to begin animation.
Surface Summary Settings
To Use Surface Summary
- Click the View Settings icon on the Main toolbar, User Defined View Settings (CTRL +V) on the View menu.
- Then click Weather & Dynamic Overlays, or the down arrow on the Weather & Dynamic Overlays icon on the Overlay toolbar.
- Then Weather & Dynamic Overlays View Settings.
- Click Surface Summary from one of the Layer Product menus.
To Activate Surface Summary
- The overlay must be enabled first by clicking the Show Weather Overlay check box in User Defined View Settings -> Weather & Dynamic Overlays or by clicking the down arrow on the Weather & Dynamic Overlays icon on the Overlay Toolbar.
- Then select Weather & Dynamic Overlays View Settings.
To turn on the Weather overlay, click the Weather & Dynamic Overlays icon on the Overlay toolbar, or select Weather & Dynamic Overlays (ALT + W) on the Overlays menu.
Click the Enable check box to activate the Surface Summary (METAR) layer. Click the Labels check boxto make labels visible and select a color for the label from the color button.
Color Selection:
- Click the color box to open the color palette.
- Select the desired color. The palette closes when a color is selected.
- Click Apply.
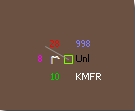
METAR Detail
Different weather condition symbols are associated with each category in METAR Detail. The categories are selectable in User Defined Views -> Weather & Dynamic Overlays -> Product Properties 2. Select the category of viewable symbols and press Apply to see each type. Color is consistent with NOAA and ADDS (Aviation Digital Data Service) color coding conventions. The checkbox, "Show METAR detail in color" when checked, uses the color selected for Labels in UDV -> Weather & Dynamic Overlays to change all the symbols to that color.

METAR Detail Sample
|
Item |
Description |
|---|---|
|
Upper Right (Light Blue) |
Altimeter reading (Inches) |
|
Middle Right (Black) |
Ceiling (Hundreds of feet or Unl for Unlimited) |
|
Bottom Right |
Station ID |
|
Upper Left (Red) |
Temperature (Celsius) |
|
Middle Left (Pink) |
Visibility (Miles) |
|
Bottom Left (Green) |
Dewpoint (Celsius) |
|
Middle Left |
Weather Symbol |
|
Middle Right |
METAR Symbol |

